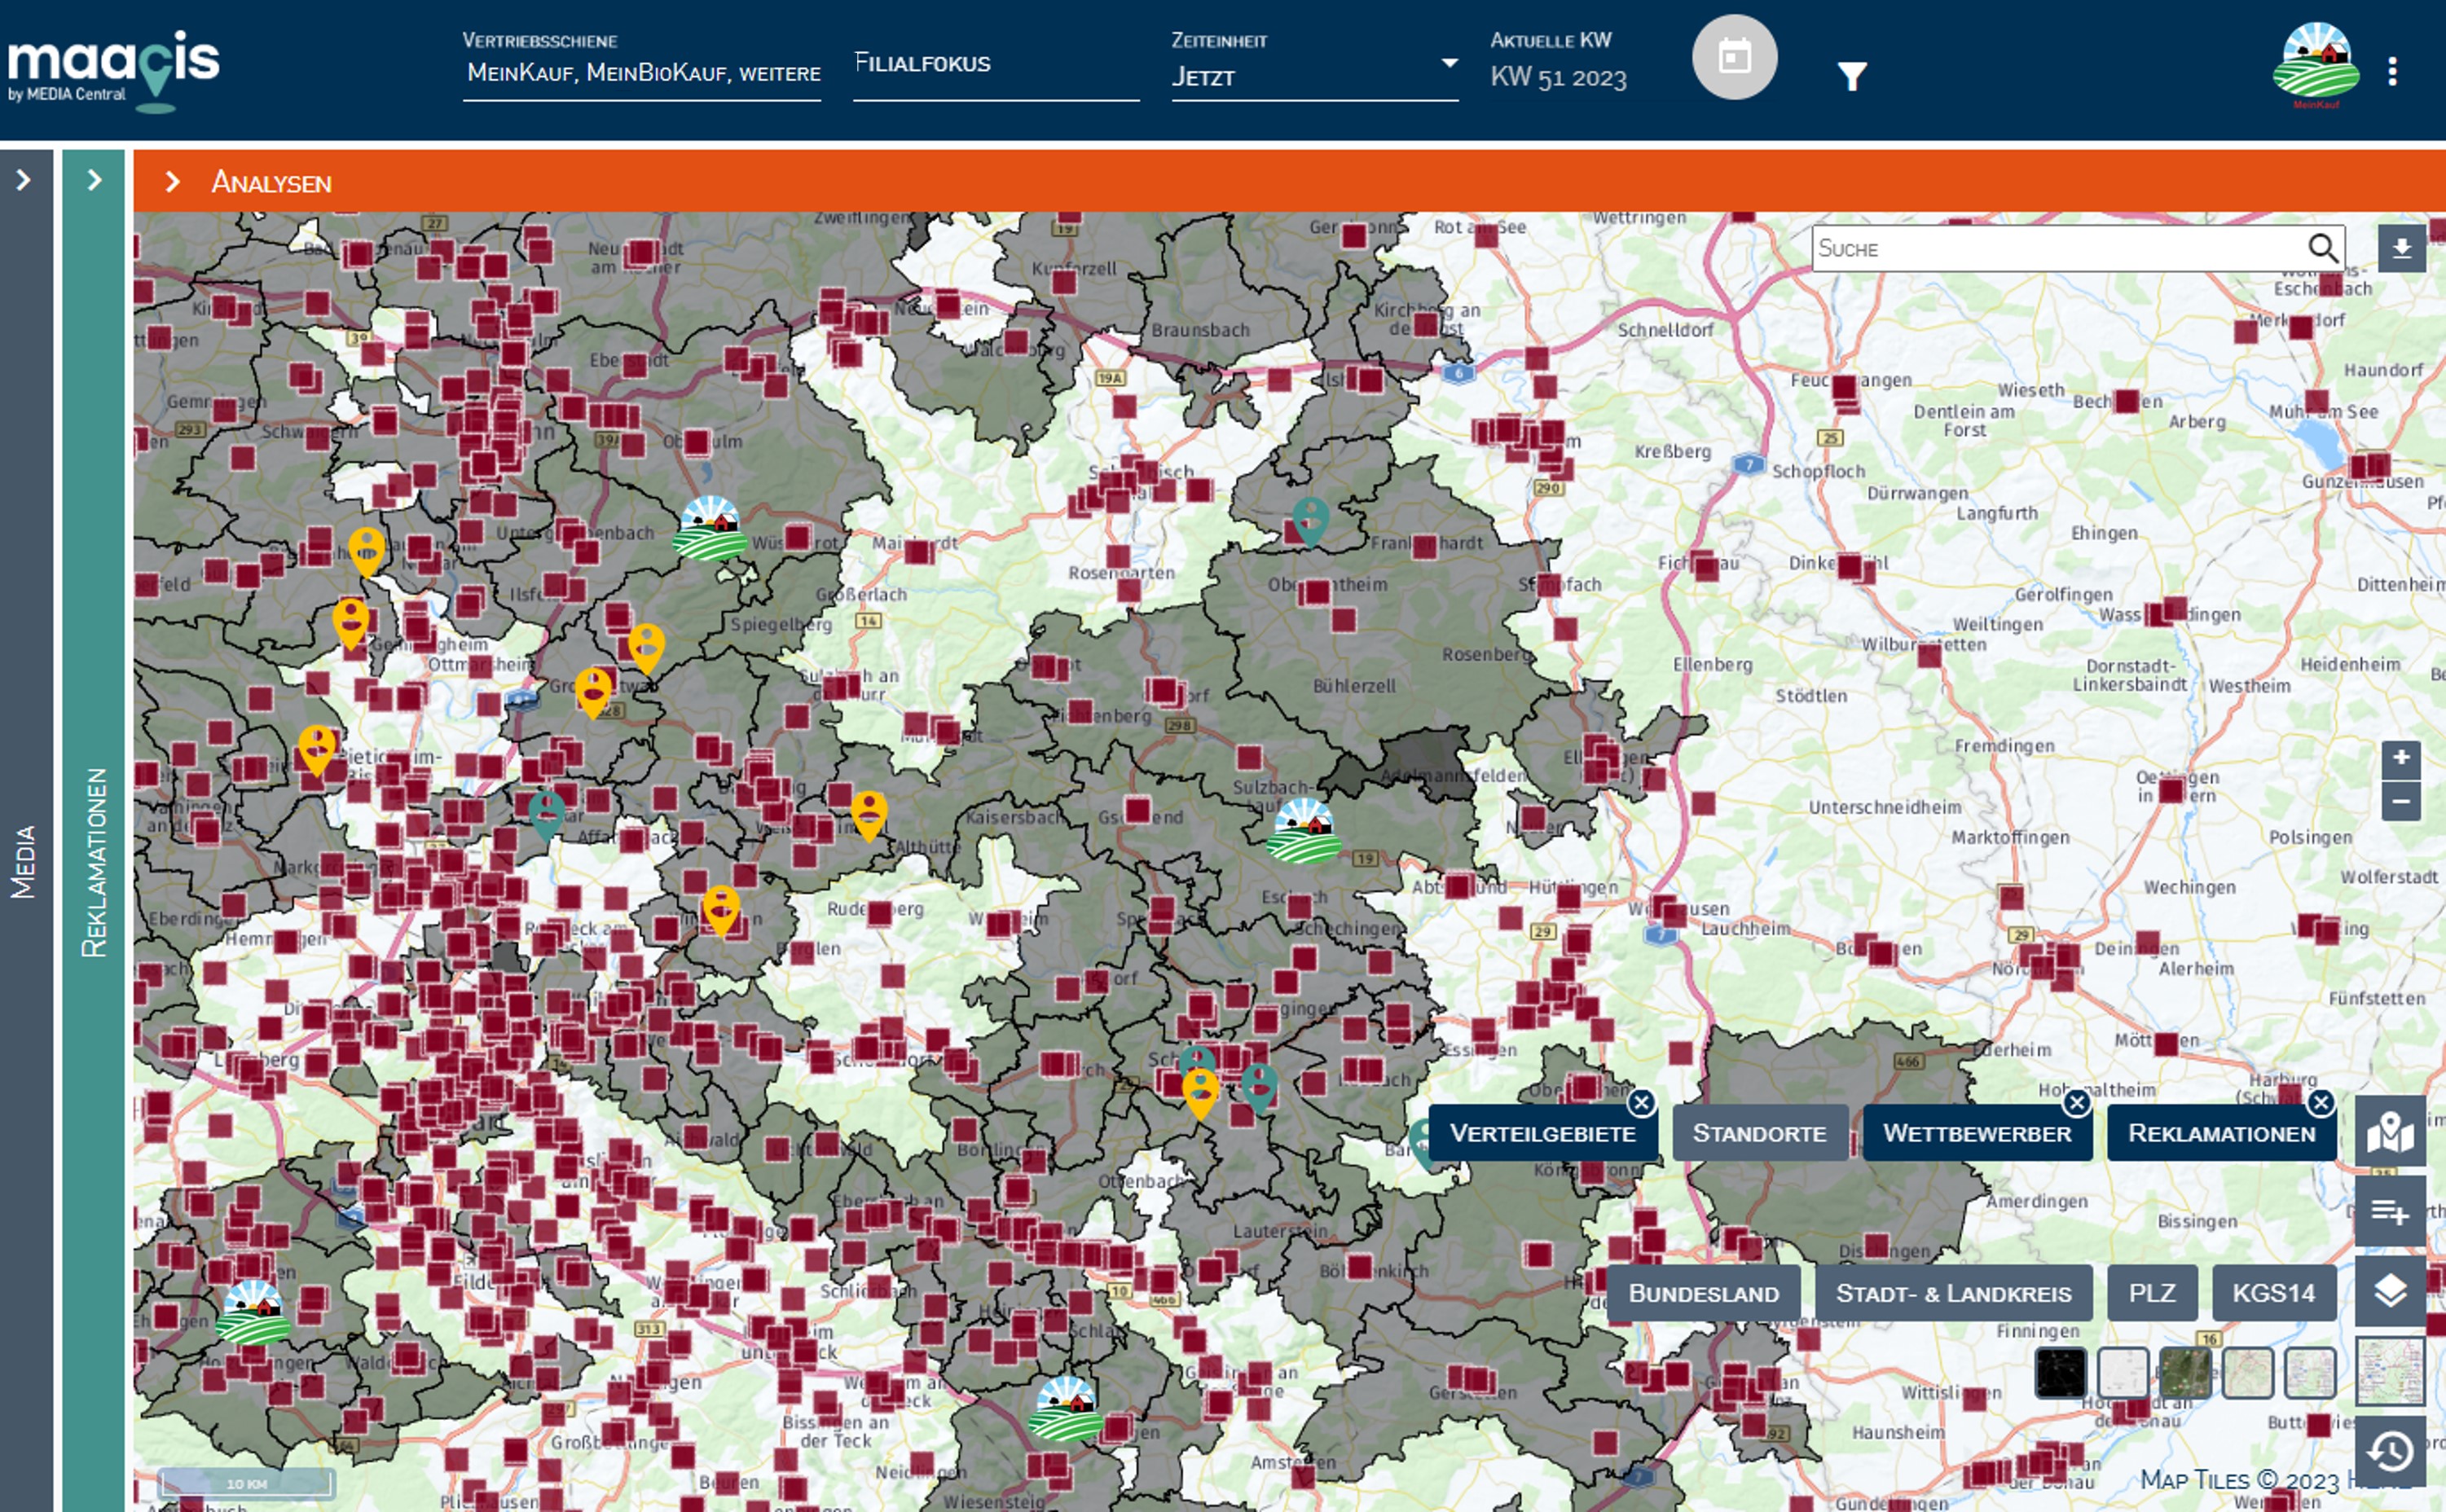
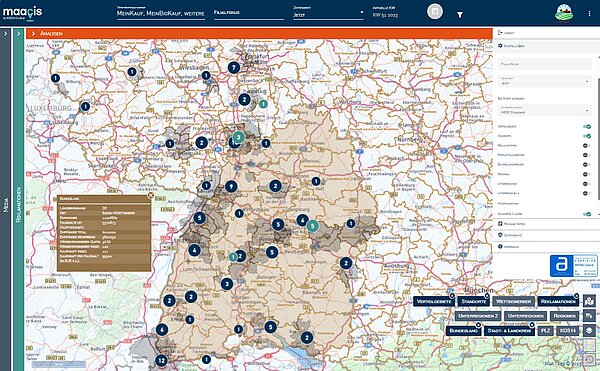
At the centre of the browser-based application is the map window, which is optimally supplemented by various functions, modules and dashboard tiles.
Fed by the expert tools of our Data Eco system, maacis offers both a fresh look at location-specific leaflet distribution areas and cross-provider click rates of digital leaflet openings at postcode level.
Retailers can carry out their own analyses on the basis of high-quality, detailed market data and weight and combine data attributes to display a wide range of target groups in the area. This supports marketing managers in determining the best media mix for specific locations as well as expansion departments by analysing the competitive situation in the vicinity of new locations.
Application examples
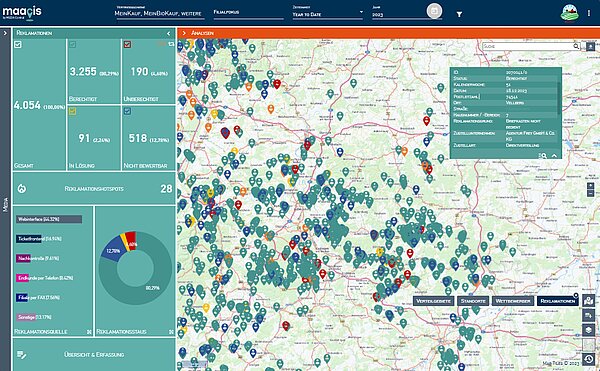
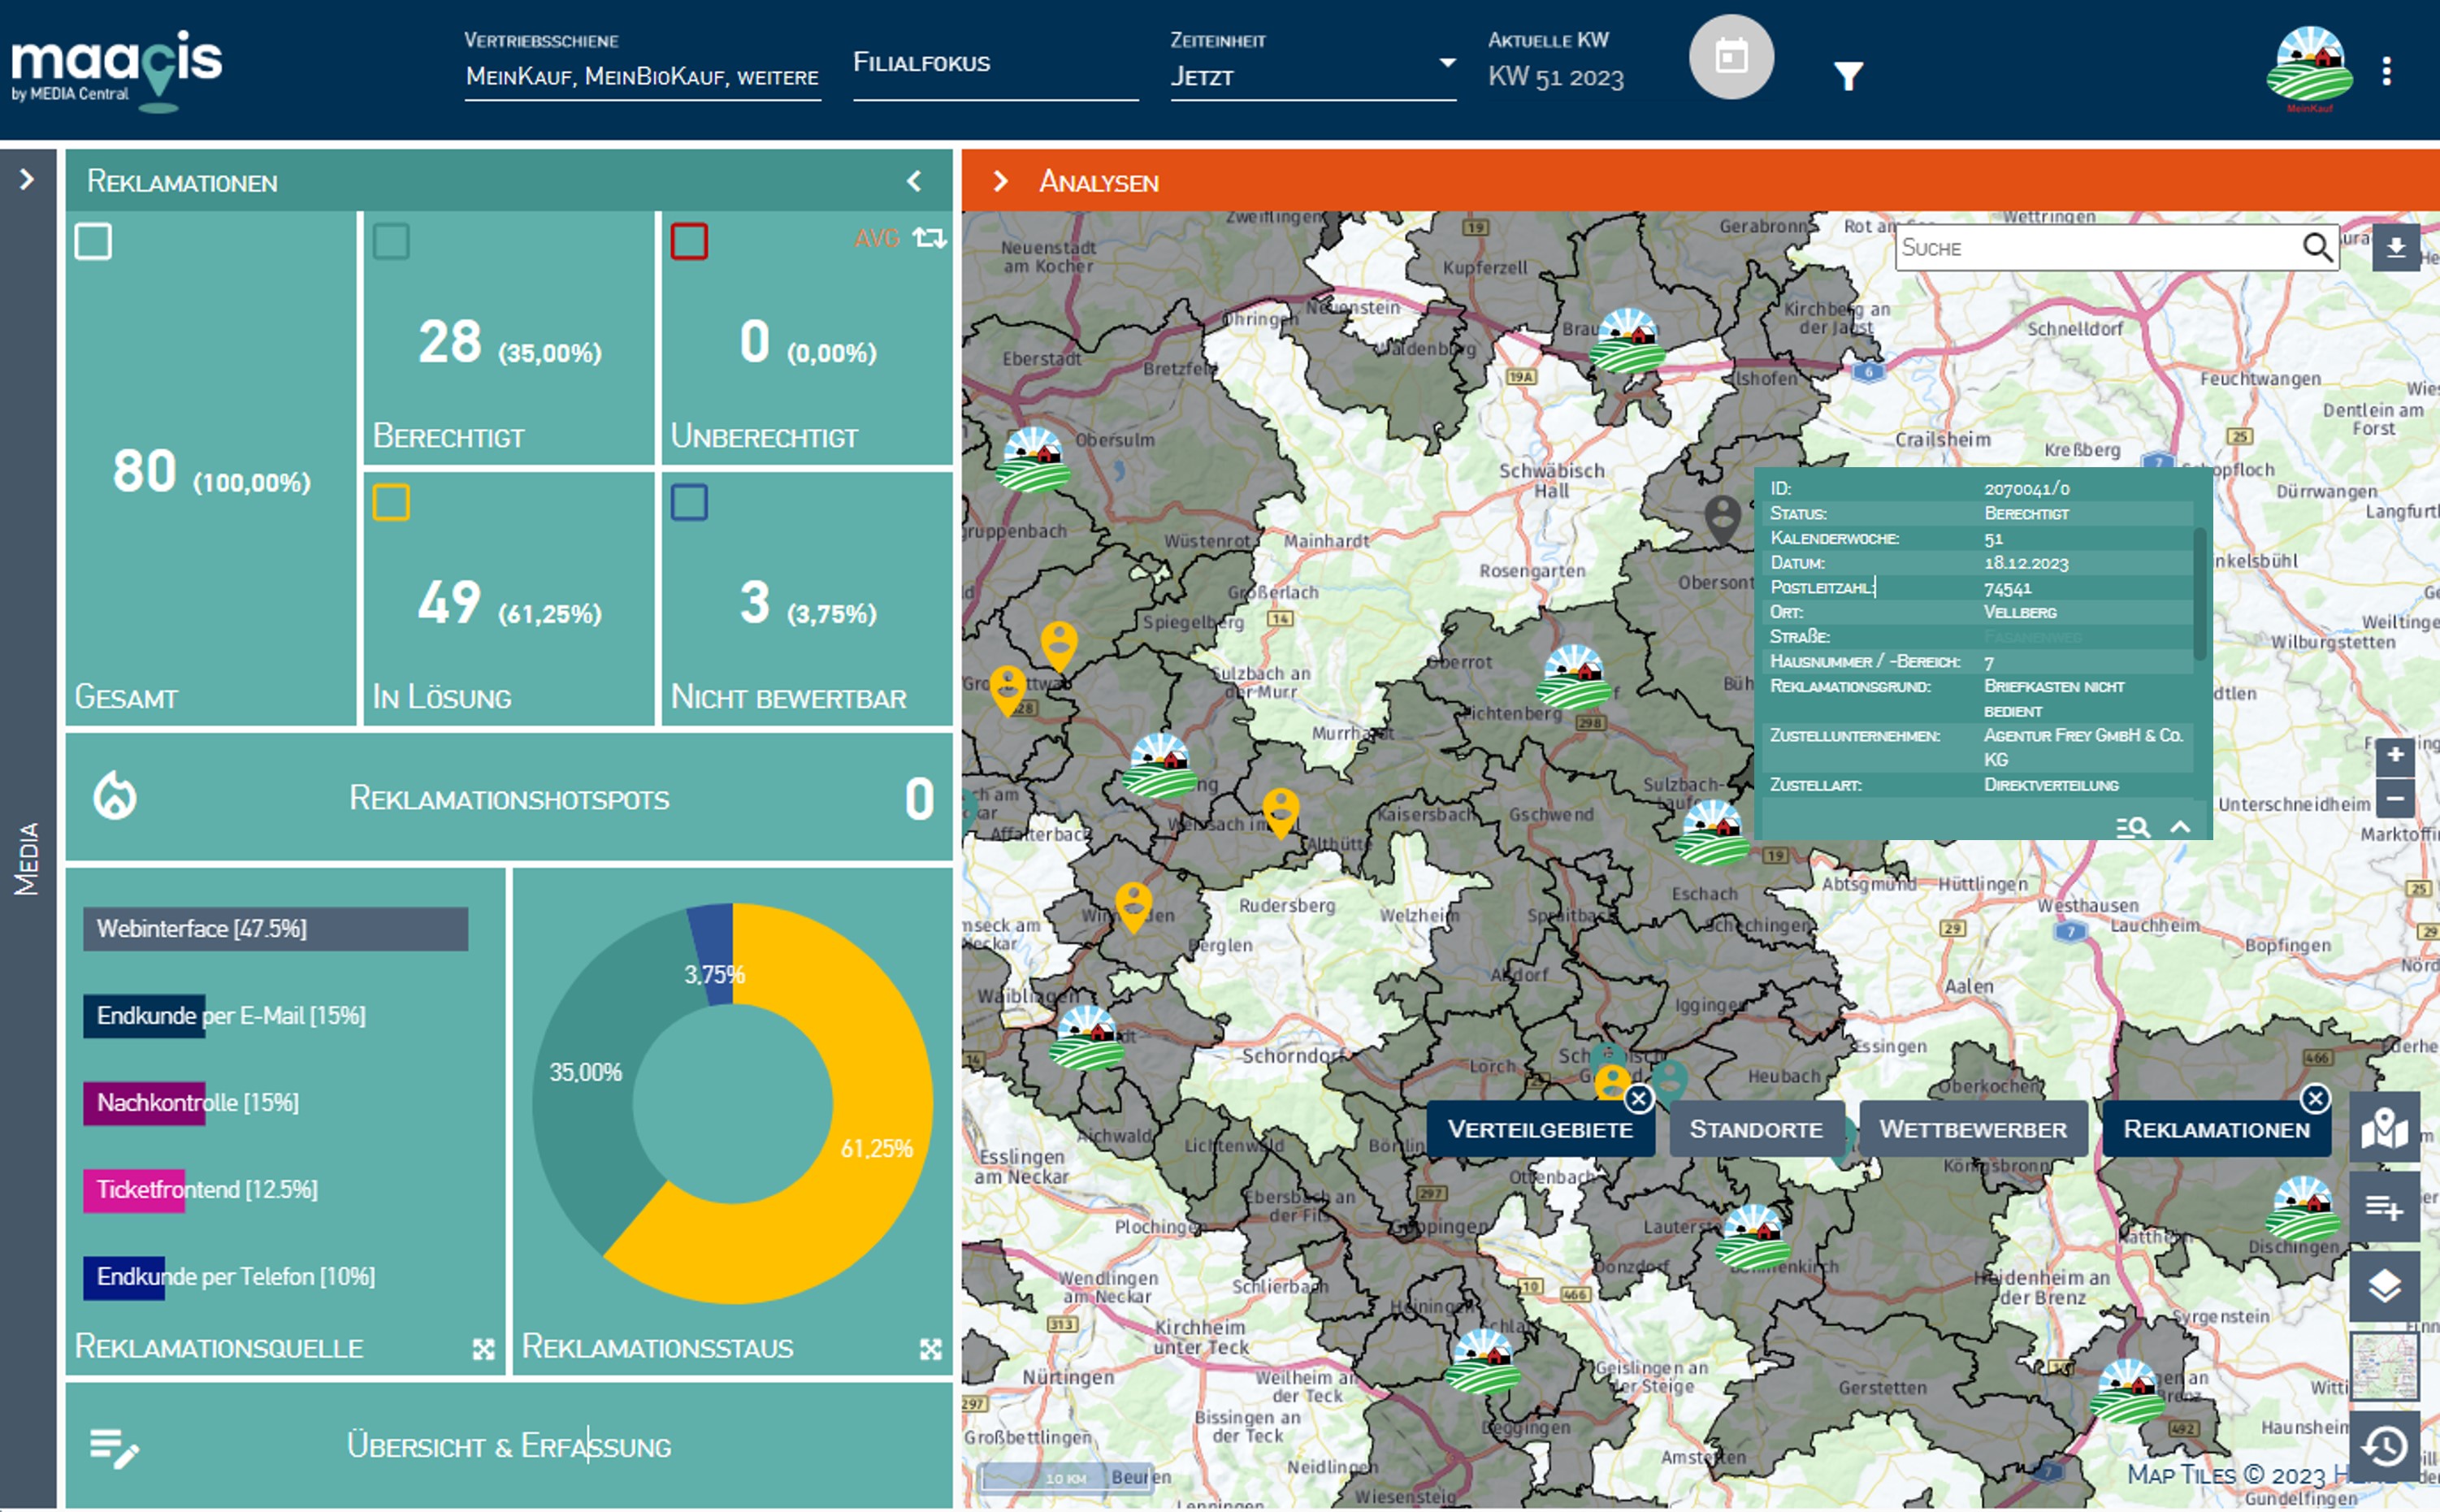
In order to make media recommendations to customers on the basis of sound quality indicators and at the same time offer the best possible transparency regarding the delivery quality of media partners, every single complaint is investigated and anomalies are checked by means of additional controls. The complaints module locates, informs and documents seamlessly from receipt to clarification.
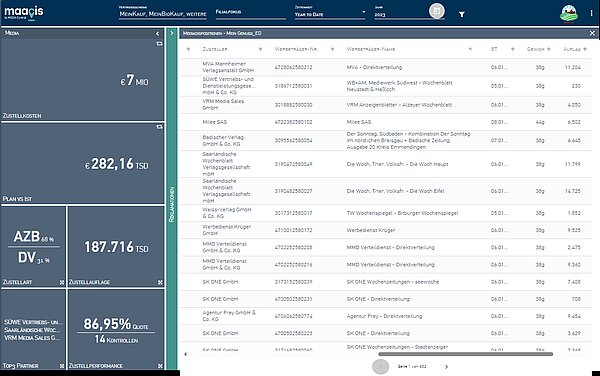
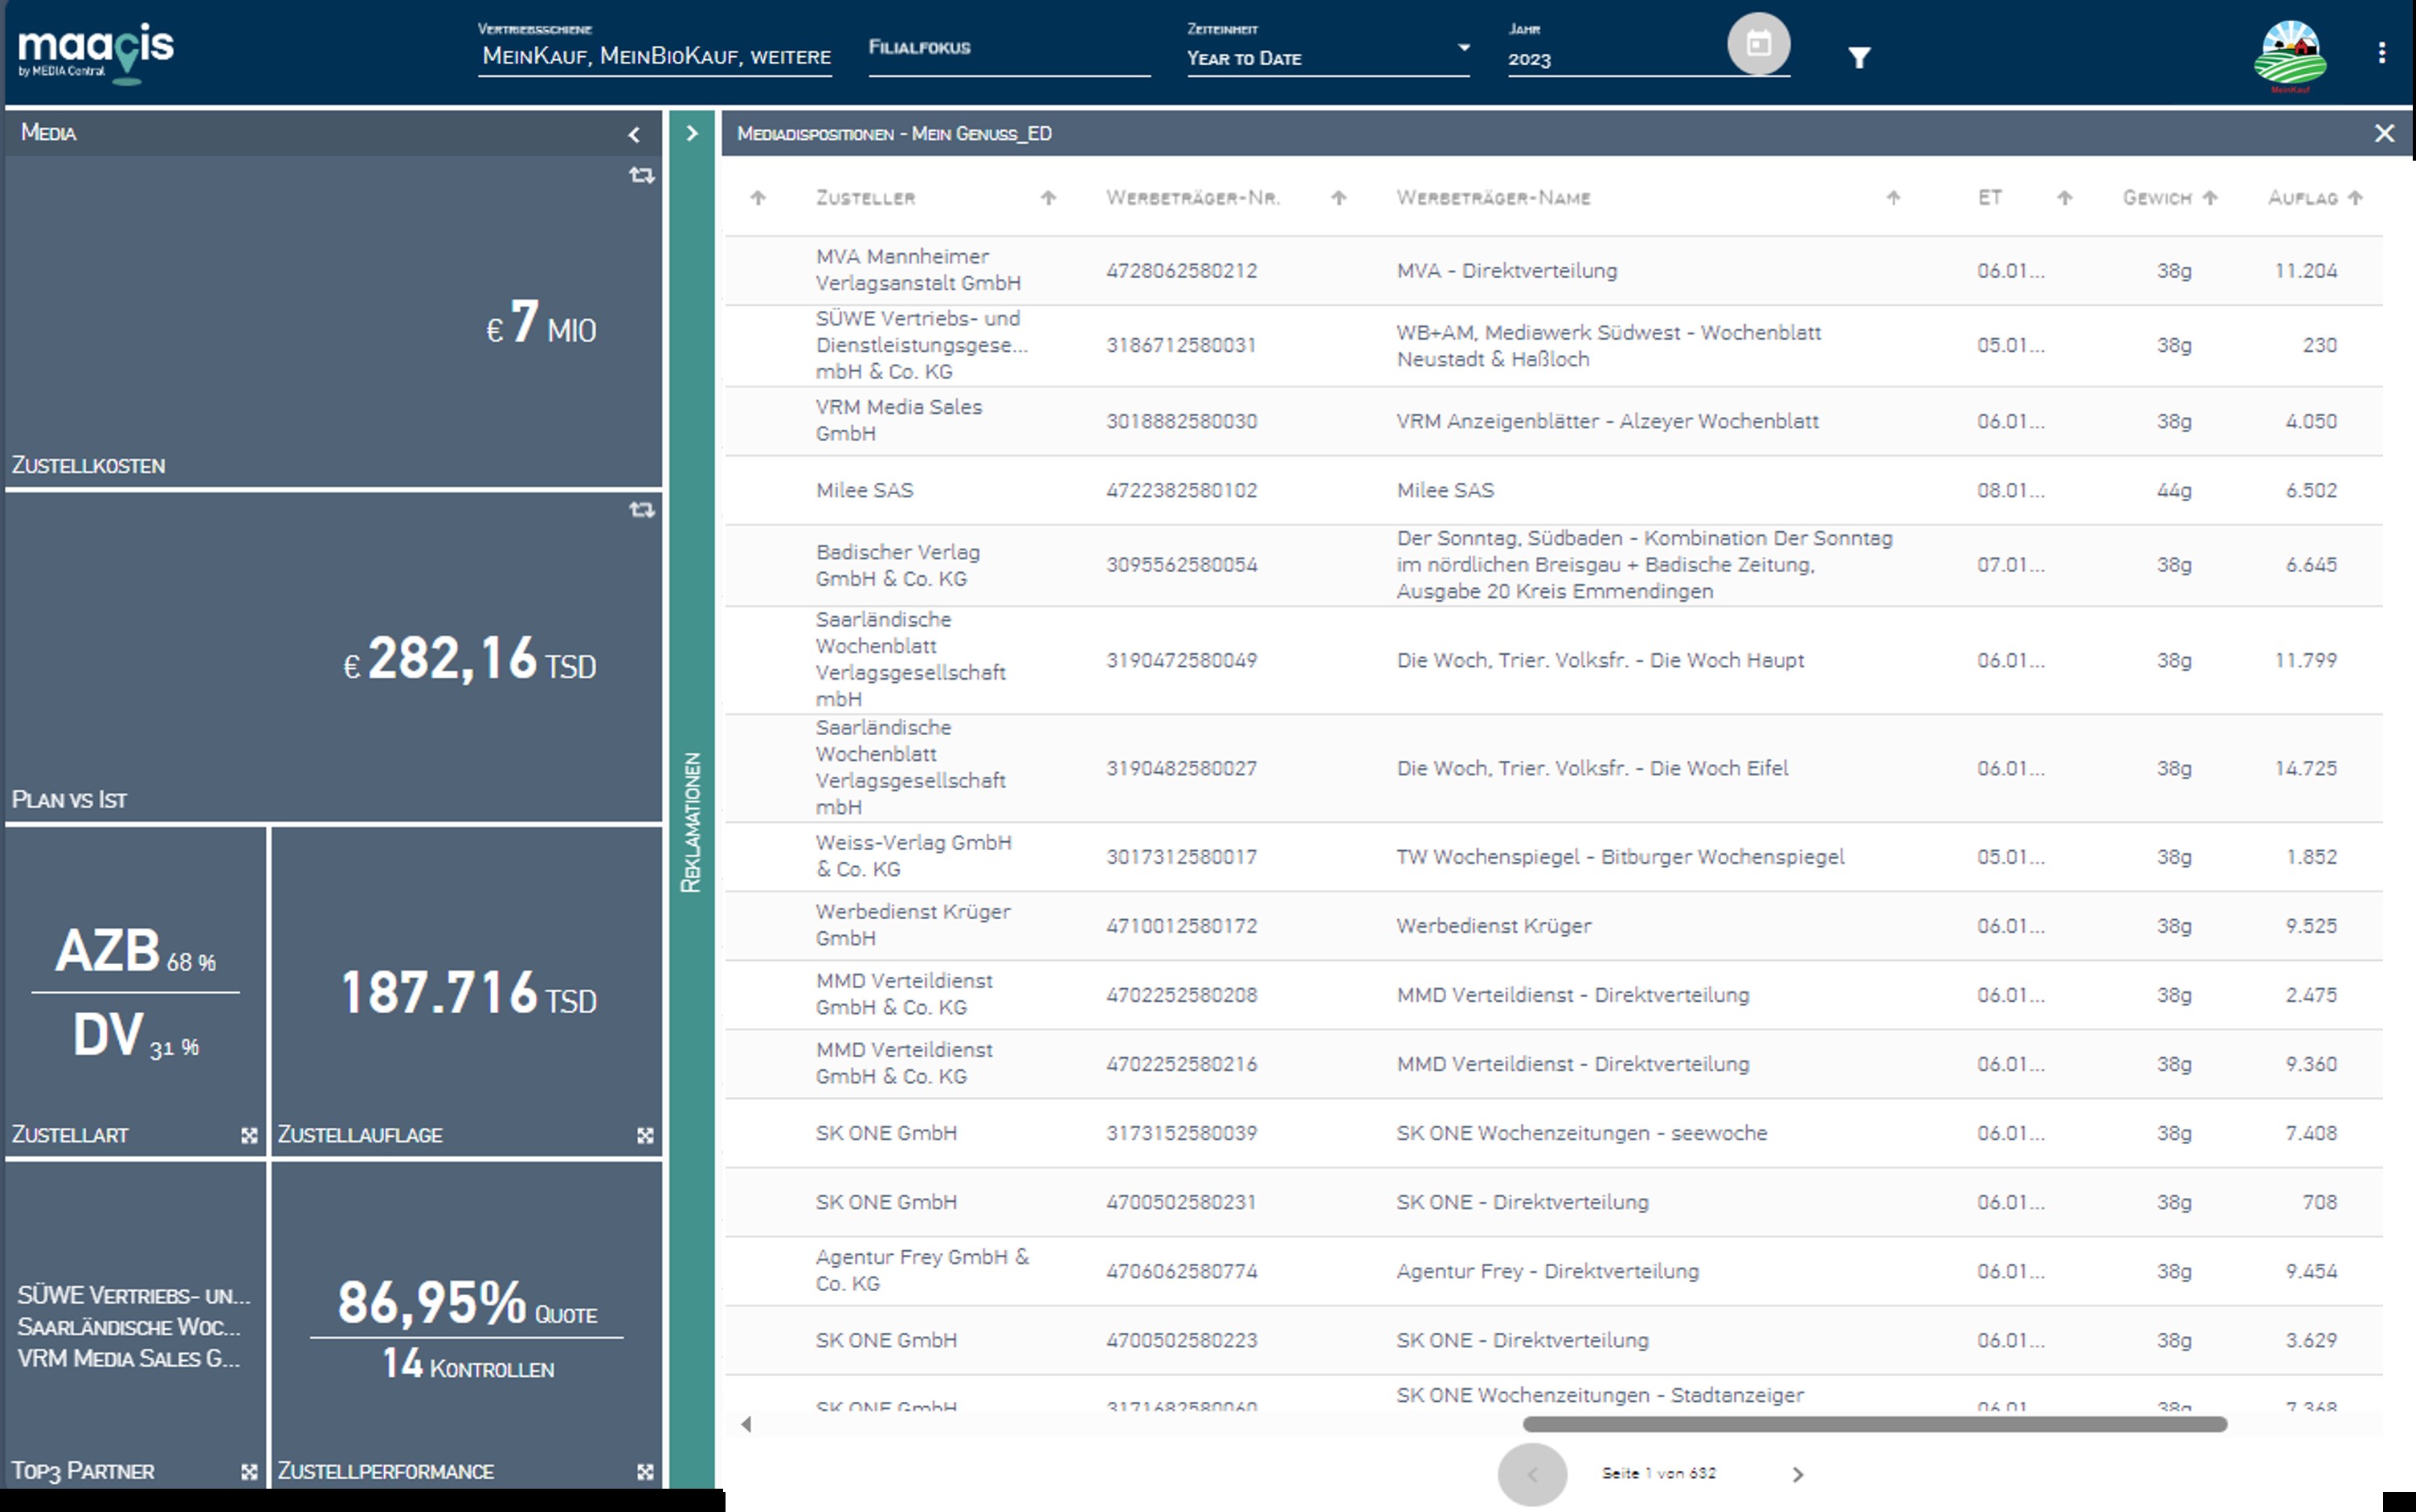
In addition to media spendings, delivery circulations, category shares and media partners, the Media module also provides an insight into our engine room. All operational measures can be tracked at the level of each branch location or advertising network, including the publication date and advertising medium, including media costs.
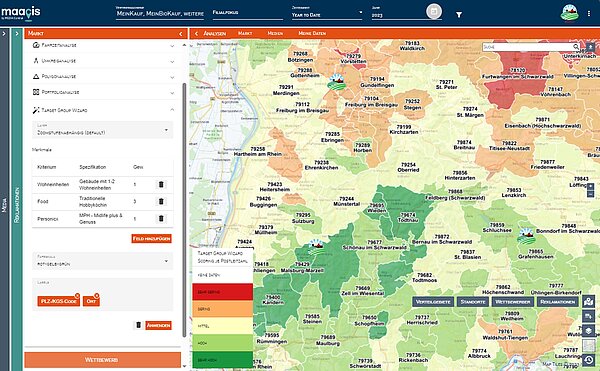
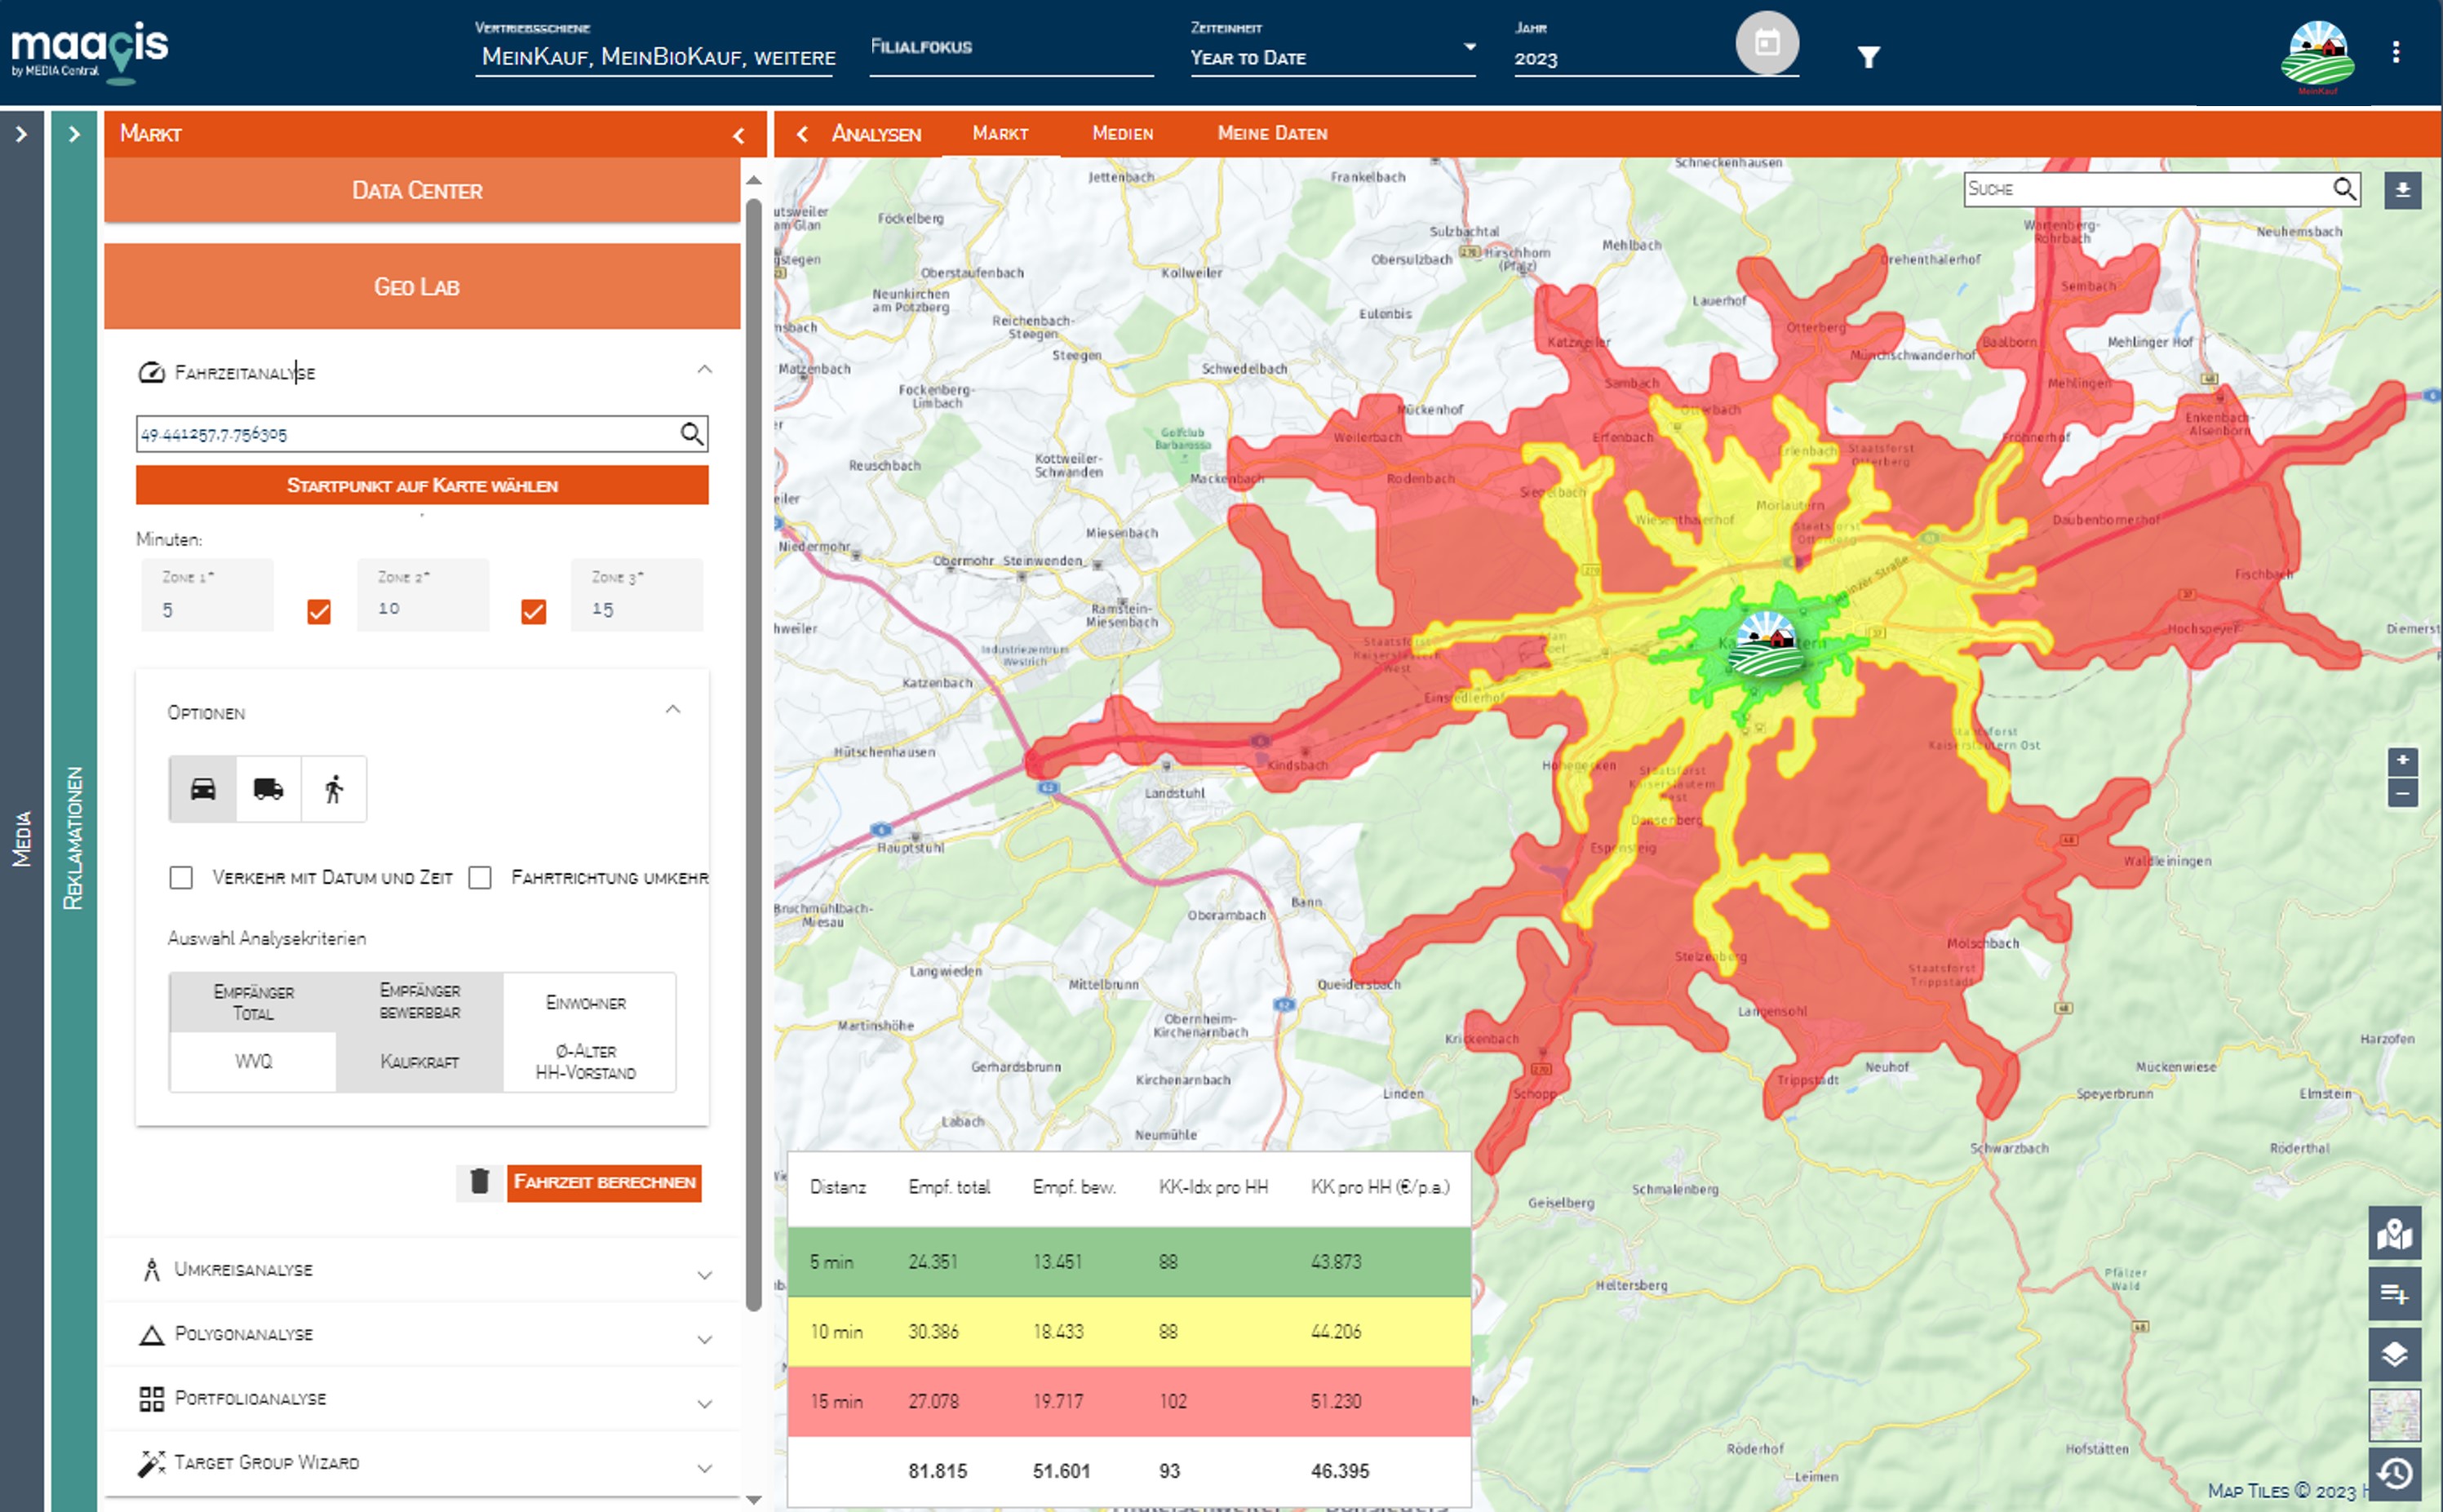
How quickly do consumers reach store locations? Which target groups are located exactly where in the area? How do sales and media costs correspond? Which media and service providers are available locally and what is best suited where? These and many other questions can be answered with the help of the Analyses module.


